Effective Uses of Tables for Teaching Algebra
Using tables can help bring challenging abstract algebraic concepts into better focus for high school students.
Your content has been saved!
Go to My Saved Content.As high school math teachers, we frequently encounter situations where students get confused about what they’re learning. They often don’t see how what we’re teaching connects to what they’ve learned before or even why it’s true. In anticipation of these concerns, we create opportunities in our lessons for students to use structure (an important skill in the Common Core math standards) to connect to mathematical ideas.
We regularly use tables or organizational charts to help students recognize structure and use it to solve problems. Tables are an especially powerful tool for teaching algebra because most students struggle with the abstract notation used in the course. Tables help students associate two sets of information (a basic mathematical task) and organize their thinking. In this article, we describe two effective uses of tables in algebra.
Area model
The methods typically taught for multiplying and dividing numbers in elementary school (the “vertical” method and long division) have several problems. First, they look nothing like each other, even though multiplication and division are inverse operations. The steps in these procedures have no meaning (“bring down the number,” “carry the two,” “move over one place”). And these methods don’t reinforce the idea of place value, which is a major theme of basic math.
Further problems arise in algebra when students work with polynomials like x2 + 4x + 2 that extend the concept of place value. While the vertical method and long division can be used in algebra, students also learn shortcuts that don't look anything like what they learned before. Unfortunately, such shortcuts encourage students to think that math is just a “bag of tricks.”
We prefer to teach the area model for multiplication and division because it allows students to connect concepts they learned in elementary school to what they learn later. Since the area model is based on the idea that the area of a rectangle is the product of its length and width, it connects algebra to geometry, enabling students to visualize the algebraic process. The table below compares the area model to more traditional methods of multiplication and division:
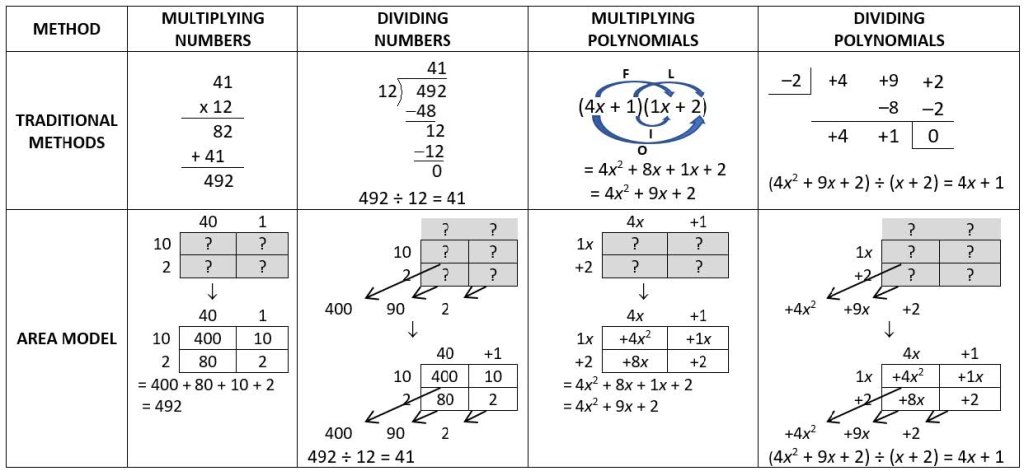
Students identify mathematical structure more clearly with the area model. It shows them the relationship between multiplication and division because students are given different parts of the same rectangle and need to find what’s missing. In addition, they see that multiplying expressions with variables is similar to multiplying and dividing numbers.
We also use the area model to solve quadratic equations, whose variable is raised to the second power. Most students use the intimidating “quadratic formula” or a method called “completing the square,” which has seemingly arbitrary steps (“take half of the middle term and square it”). In contrast, the area model illustrates why completing the square has that name—students draw an incomplete square and then find the number (in this case, 9) that completes the square, as shown in the following diagram:
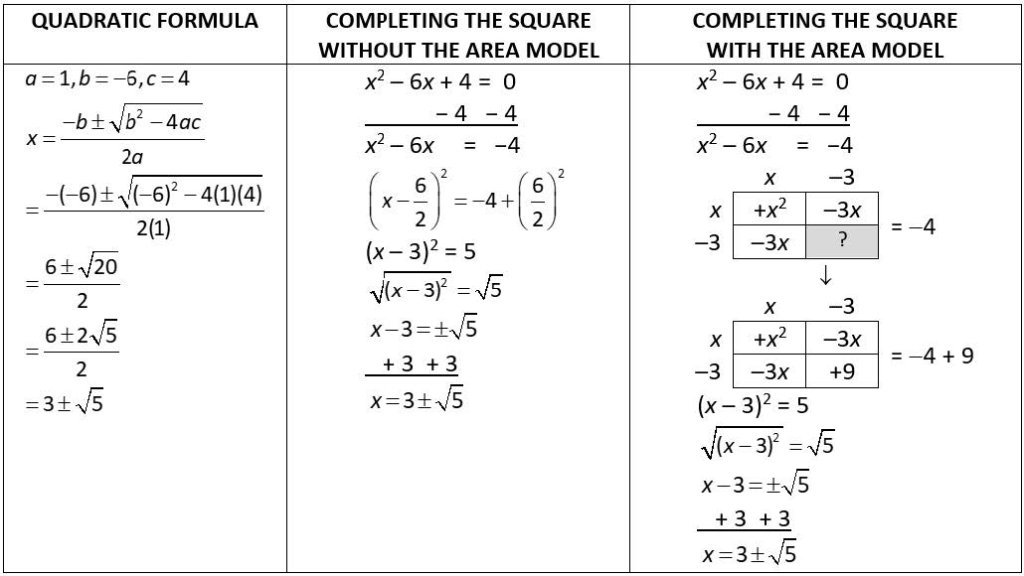
Completing the square taps into students’ visual memory. It not only enables them to remember steps more easily but also helps them understand why the process works. This strengthens their mathematical understanding.
Solving word problems
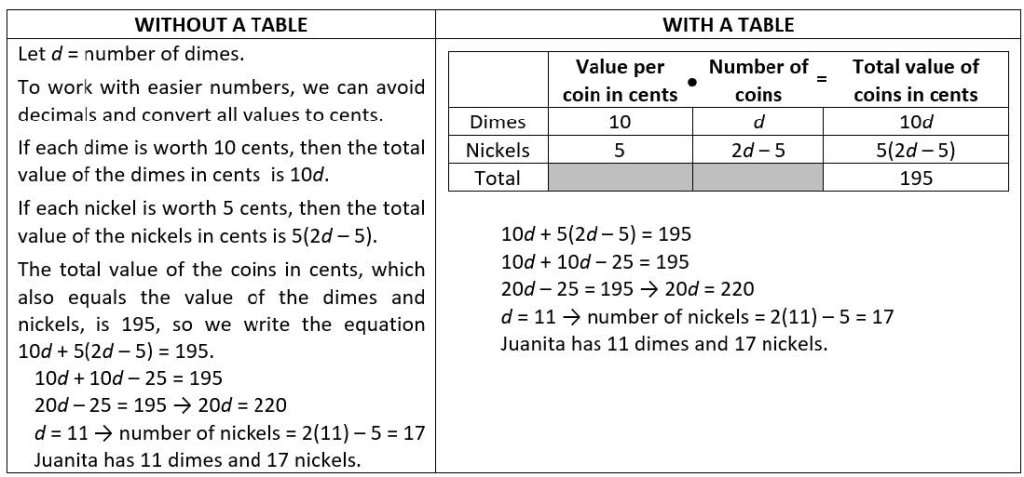
Many students have difficulty determining how to translate words into mathematical symbols, especially with word problems like this: “Juanita has a bag that contains only dimes and nickels. The number of nickels is 5 less than twice the number of dimes. The total value of the coins in her bag is $1.95. Determine the number of dimes and the number of nickels in her bag.”
Students could resort to a tedious verbal description that explains each part of the equation needed to solve this problem. In contrast, writing a table enables students to organize their information more easily and clearly. From the last column of the table, they can derive the equation 10d + 5(2d − 5) = 195, as shown here:
One of our favorite applications of tables is using them to solve word problems involving probability, such as the following one: “A classroom bookshelf has 10 books, each of which has a color (red or green) and a binding (hardcover or not). Six books are hardcover, 7 are red, and 4 are red and hardcover. A teacher randomly chooses one book from the shelf. Find the probability that it will be hardcover, given that the book is red.”
This could be solved using the conditional probability formula, which has cryptic symbols like P(A|B). By organizing the given information into a table, students find the probability by identifying the appropriate numbers from the table:
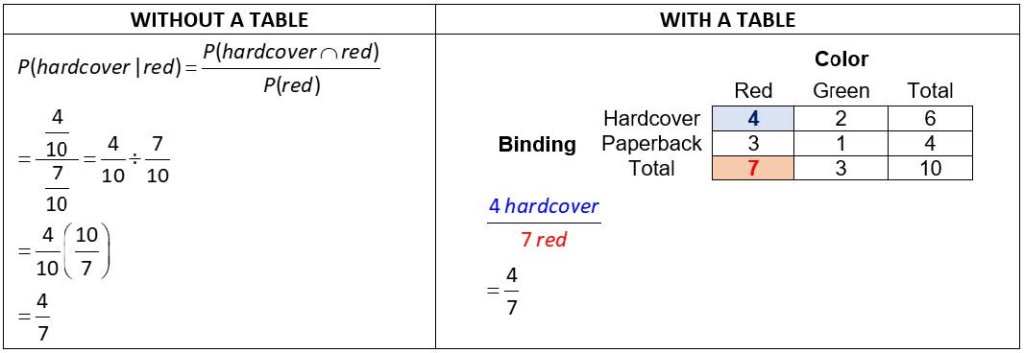
Creating a table demystifies the process of translating words into math symbols, which benefits all students.
As students get accustomed to organizing information into tables, they improve their ability to communicate mathematical ideas. Since tables can be incorporated into many different math topics, they reinforce prior knowledge and improve students’ confidence. Using tables also strengthens equity by making challenging mathematical concepts more accessible.
