Moving Beyond Traditional Lab Reports in High School
A teacher who wanted to shift from assessing compliance to assessing students’ thinking shares the tweaks she made in her assignments.
Your content has been saved!
Go to My Saved Content.How can we shift from grading for completion to assessing for thinking?
Grading labs has always been a challenge in science. After a while, everything starts to blur together: identical graphs, similar conclusions, and answers that all sound the same. Students are usually very good at completing the lab as instructed, but I’m not sure that they’re thinking through the science behind it. Can they connect the lab to the concepts we’re learning and see purpose in what they’re doing?
I started thinking about how to change the way I was grading labs. How do I shift from assessing compliance to assessing thinking? How do I avoid answers that are just copy-pasted from Google? How do I know if students really get it?
These questions push me to rethink how I create assignments and assess work in my classroom. I want to know if they get the concept, not if they can Google it. Can they analyze it, apply it, make sense of it, and have fun while doing so? Instead of thinking “How will I grade this?” I reframed my thoughts to “How can I make student thinking more visible?”
Students Can Gather Their Own Data
Students can easily Google vocabulary or terms, but it’s much harder to Google explanations for data they collected themselves. In my medical microbiology class, we conducted a lab where groups tested how types of sugars impacted the fermentation rate of bacteria. Each group ran the same experiment with a different type of sugar and submitted a simple Google form.
In the next class, we looked at combined class data. I prompted students to “question everything.” Students had to annotate the data table with thoughts, questions, and assumptions they had made. The discussions that followed showed far more critical thinking and scientific thought than a traditional conclusion paragraph ever had.

What surprised me the most was how quickly my students started to notice flaws in their own experimental design after doing this activity. The debates on sources of error and outliers became less about pointing fingers or getting a correct or better answer and more about making sense of data and evidence, which is much more like authentic scientific thinking.
Annotating Images Demonstrates Understanding
In my anatomy and physiology class, we do an initial dissection to practice the use of medical terminology and directional terms. Instead of a quiz over terms, they take pictures of their pets or use a baby picture of themselves.
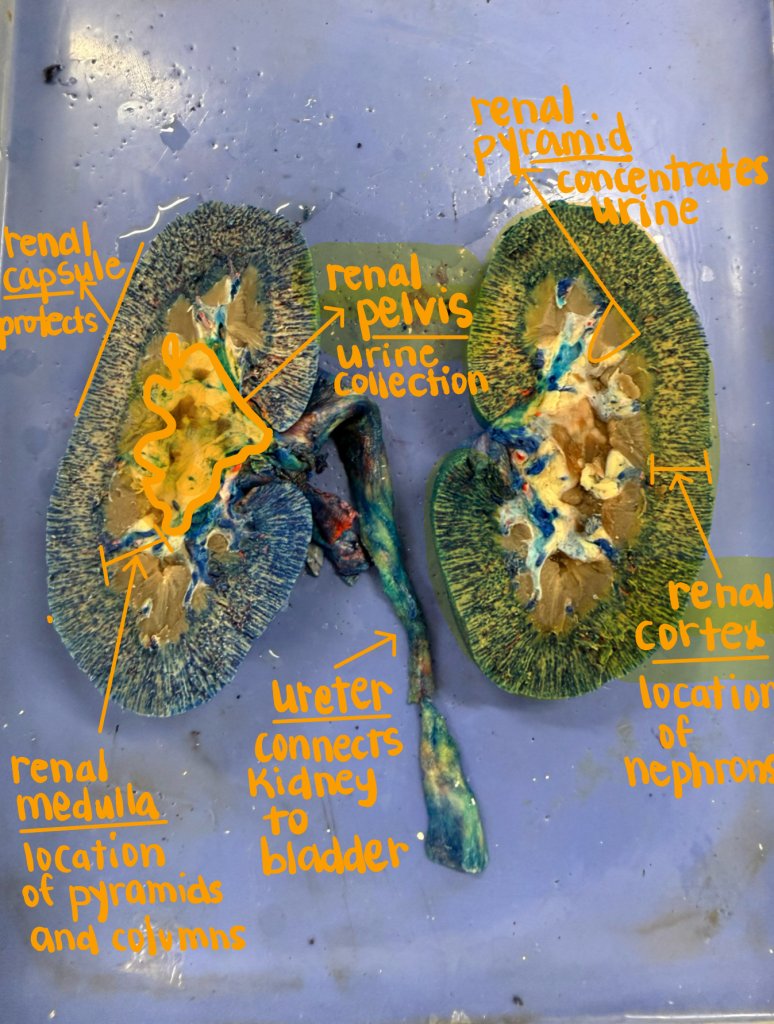
We also use annotated images when dissecting in a lab. For example, students dissect and take pictures along the way. They can select their best images and label the structures they see. By annotating the images with directional terms and medical terminology, students demonstrate understanding in a much more authentic way than a traditional vocabulary quiz.
Presenting Data Analysis as an Infographic
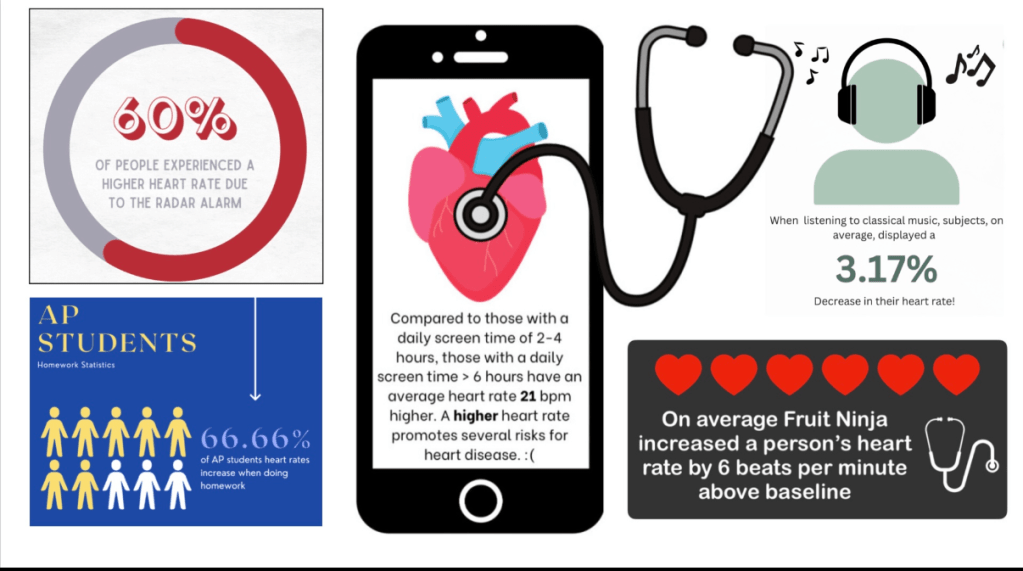
One of my favorite ways to have students analyze labs is to create a snapshot or infographic of data. I usually prompt them with, “If you could share your data with one visual and fewer than 10 words, what would it look like?” In my anatomy and physiology class, we did a Valentine’s Day–themed lab called “What Raises Your Heart Rate?” It’s a fun, quick activity that teaches pulse points and allows students to design a quick investigation process.
Groups then discuss how the experiment was conducted, identify flaws in data collection, and suggest improvements if the lab were to be repeated. This gives students a chance to defend their argument and the data they collected, and consider peer review for improvement. As for grading, the snapshot or infographic is just a portion of the grade. I use a rubric to assess each part of the experiment, such as planning and experimental design, snapshot, and reflection. I combine all sections to create one grade.
I‘ve noticed that when I give my students opportunities to explain science creatively, they take more ownership of their learning. Traditional labs sometimes encourage students to think about formatting or compliance and completion. Open-ended assessments require students to make decisions on how to best communicate their data, which shows teachers much more about what students actually know.
Model and Write Conclusions
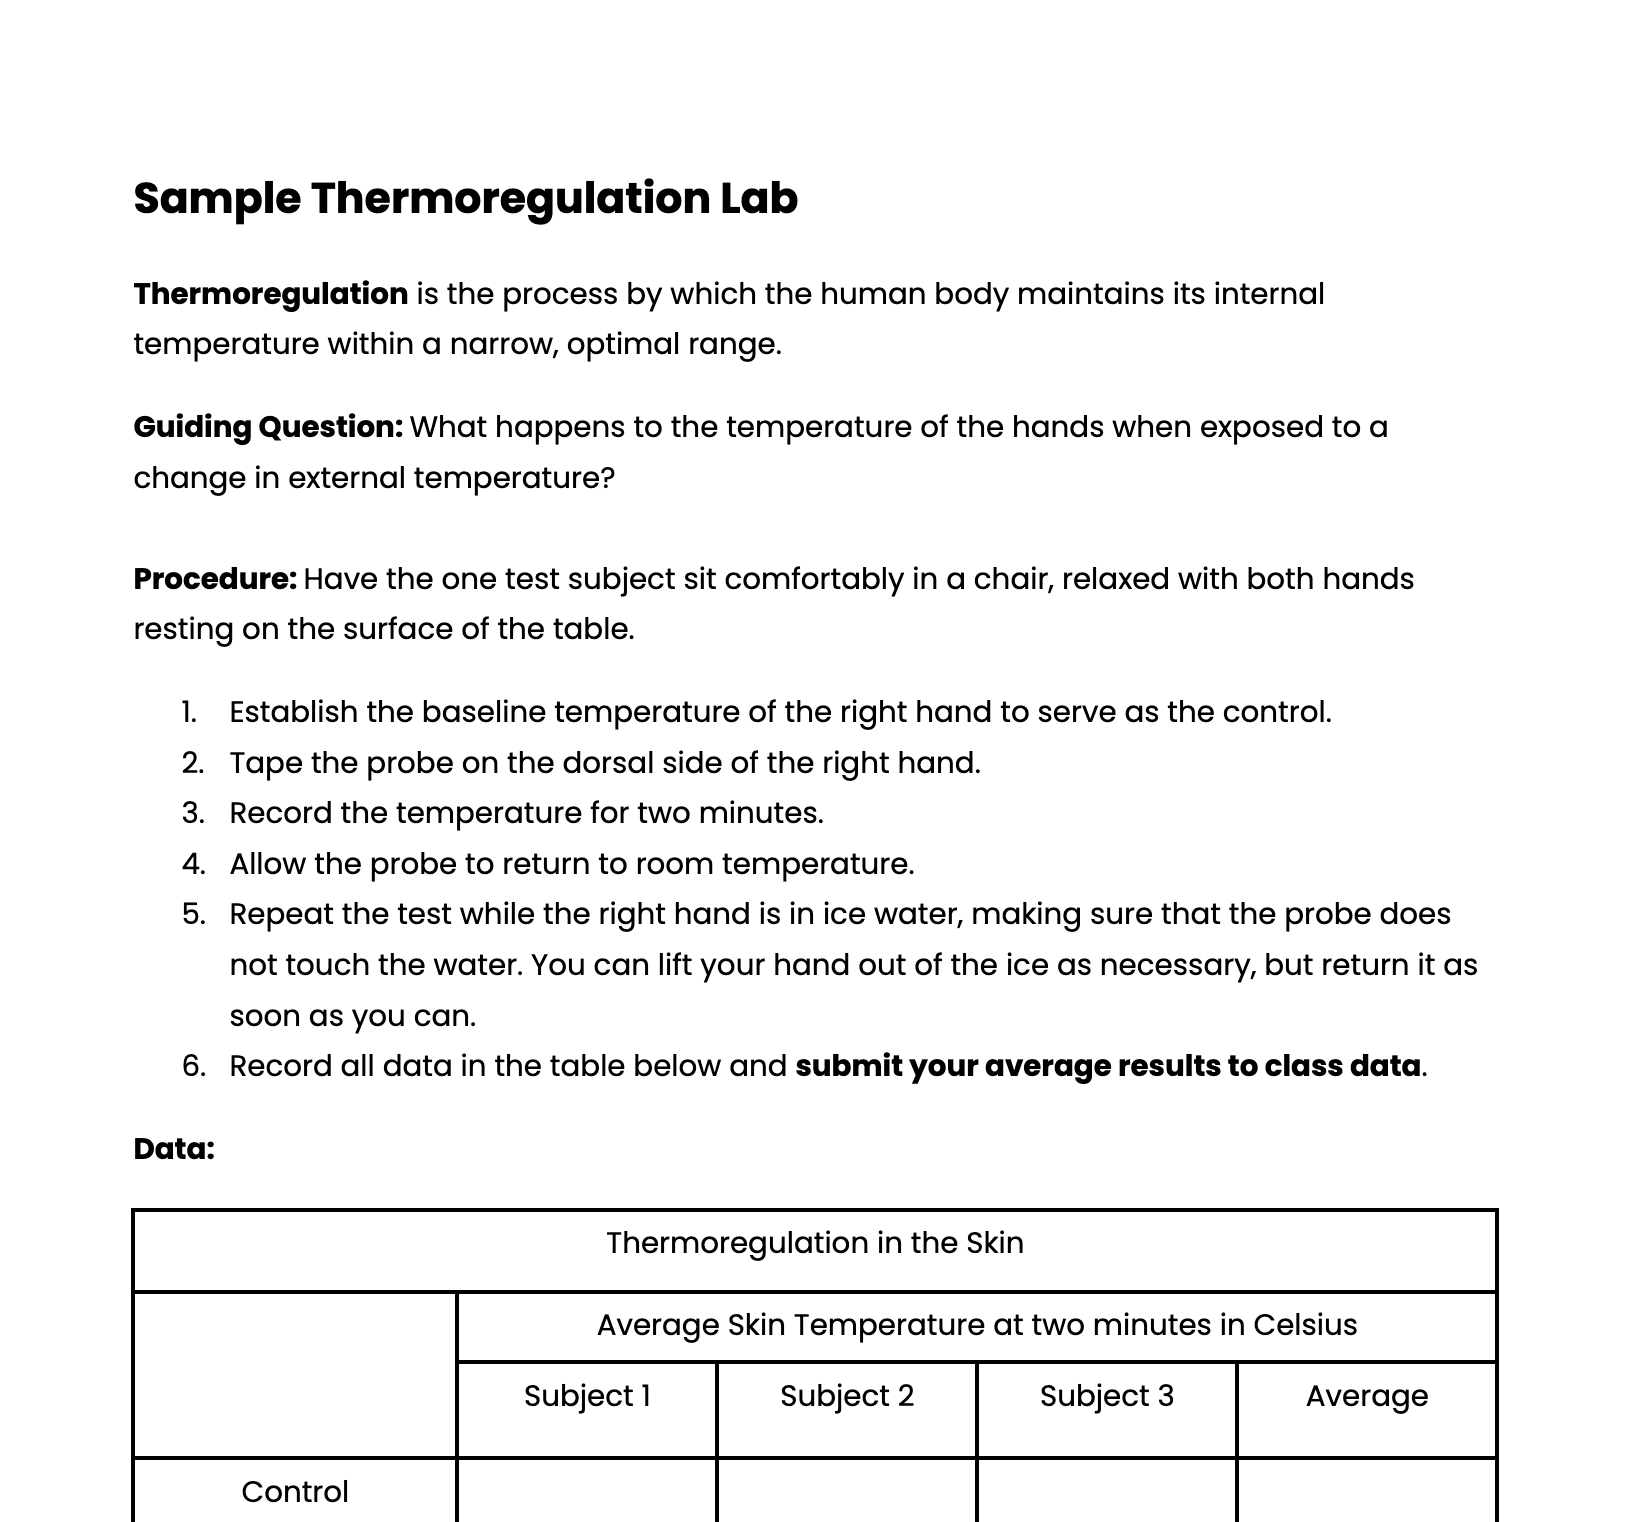
Modeling the lab explanation is another way to help students visualize their thinking. We conducted a lab where students changed the temperature of their hand by placing it in cold water or a warm glove and measuring the temperature change of the surface of the skin. Instead of just writing a conclusion, I have them draw. In my experience, I’ve found that drawing feedback loops or flowcharts helps students visually organize and understand cause-and-effect relationships. Misconceptions become easier for me to identify because student thinking is clearly on display. We have done this work in Canva or even using chalk markers on our lab tables.
Many students can define homeostasis as “balancing” or cite the example of temperature regulation but might struggle to create a visual model that shows it in action. Models like these help me see a clear picture of student understanding or where the reasoning went wrong.
Consistent Grading With Rubrics
These assignments might sound more challenging to grade, but I find the opposite to be true. Since students are producing unique responses, it’s easier for me to see their true understanding of the content. For example, in our thermoregulation lab, I use straightforward rubrics and grade students across five categories (pre-lab, lab, lab model, analysis questions, and conclusion).
Keeping my eye focused on analysis, reasoning, communication, and experimental design helps keep grading manageable and shifts focus away from simple completion.
I still use labs in my classroom all the time, but I no longer view them as simple assignments to complete. They are opportunities to uncover student thinking. I want to help students learn to question, analyze, troubleshoot, and make sense of the science. The goal isn’t to eliminate structure, it’s to make sure our assignments reflect how scientists actually think.