A Way to Make Fractions Easier to Understand
New teachers can help simplify the complexities of fractions for students by using an unexpected tool—a multiplication chart.
Your content has been saved!
Go to My Saved Content.
Multiplication facts. I’ve never understood why, in all the years I’ve taught mathematics, we’re still calling the rows and columns of skip-counted numbers multiplication facts. To my mind, aren’t they also division facts? 5 x 6 is 30, which I can locate on my multiplication chart fairly easily, but 30 divided by 5 has only one answer, 6. All I have to do is find 30 on the chart, locate 5 to the left, and I’ll find 6 above. Voilà. I can use the exact same chart as a division facts chart to find the answer, if I think of it that way.
I’ve also discovered other uses for this chart, which can help new teachers make more complex math concepts easier for students to understand.
One of my favorite ways to use it is with fractions. Throughout the year, my students and I “evolve” the multiplication chart into a fractions chart. I wish I could take credit for all the ways I’ve learned to use this evolved chart, but I can’t. Year after year, kids come up with the most incredible ways of using it for any part of fraction work you can think of. Here are some that have been successful in my class.
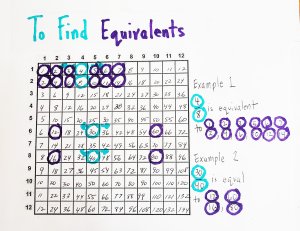
1. Use the Fractions Chart to Find Equivalents
Equivalent fractions are often found by multiplying or dividing by the same number to both numerator and denominator. For example, 4/8 can be divided by 2 to find 2/4. Or, 4/8 can be multiplied by 2 to find 8/16. Both of these fractions are equal to 1/2. It’s good if new teachers also make sure to help students build models of these equivalents.
The multiplication chart can also give you equivalent fractions simply by lining up the numerator and denominator on the same column. Try it out. Find 4 and 8 on the chart where 4 and 8 are on the same column. Move right and find equivalent fractions, or go left and find equivalent fractions. Going right means the fraction has more pieces, but they’re smaller. Going left means the fraction has fewer pieces, but the pieces are bigger. It works for any fraction. For 6/24, go right one column and get 7/28, or two columns and get 8/32. Go back one column and get 5/20. Continue on, and all of those fractions are equal to 1/4.
2. Use the Fractions Chart to Simplify Fractions
My students and I often use the chart make sure that our answers are in simplest form. Say your answer is 32/40. Typically, we can detect a greatest common factor, or GCF, and “divide out.” Doing this gives us 32 divided by the GCF of 8, which equals 4, and 40 divided by 8, which equals 5. Therefore, 32/40 is equal to 4/5 in simplest form. But not everyone sees that so easily, and even models can take a lot of time to build. Just find 32 and 40 on the chart when they’re on the same column. Then, move left until you reach the first column, which gives you 4/5.
Note that when the fractions you want to simplify aren’t on adjacent rows, you may get simpler fractions that aren’t completely simplified. For example, using the same technique, 36/48 will lead you left to 6/8, which isn’t fully simplified. If you then take 6/8 in a column where they happen to be in an adjacent row, you’ll arrive at the simplified fraction 3/4, by sliding left.
3. Use the Fractions Chart to Compare Fractions
Everyone has a system to compare fractions. In my class, we build number lines, we make models, and we especially find common denominators. But once again, the fractions chart is here to help. Let’s take 1/4 and 1/5. We know that 1/4 is larger than 1/5. Maybe we see a model in our minds. Maybe we know 4 is fewer pieces, and therefore 1 out of 4 is a bigger share than 1 out of 5.
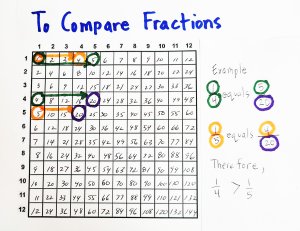
Maybe we convert each fraction to have 20 as the denominator to find that 5/20 is bigger than 4/20. We can use the fractions chart as a backup. Just find 1 and 4 on the very left column, and also find 1 and 5. Move both 1/4 and 1/5 over on the chart until you land on the same denominator, 20. You’ll notice that 1/5 stops first at 4/20, while 1/4 keeps going until it arrives at 5/20. This works on other fractions too. For example, 2/5 and 2/3: 2/5 stops at 6/15, while 2/3 keeps going until 10/15. 2/3, or 10/15, is therefore larger than 2/5, or 6/15.
4. Use the Fraction Chart to Add and Subtract Fractions
If a student adds 1/3 to 1/4 and arrives at 2/7, we know that is a wrong answer because 1/3 and 1/4 are two differently sized fractions. To solve the problem, we typically find a common denominator so as to add the same-sized pieces. The good news is that our fractions chart is a ready-made way to find the least common multiple, or LCM.
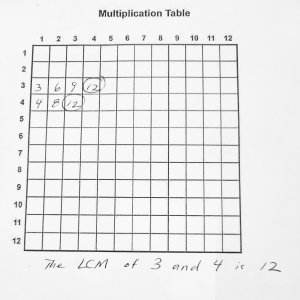
Students can trace the skip-counted numbers on both row 3 and row 4 until they arrive at 12 as the LCM for both numbers. Then, they can count the number of movements right, or columns they moved in order to get there. This tells them what to multiply by for both numerator and denominator. In this case, there were four columns moved for 3 to become 12, so 1/3 is multiplied top and bottom by 4 and becomes 4/12. Meanwhile, we moved three columns to get 1/4 to a common denominator of 12. So 1/4 is multiplied top and bottom by 3 to become 3/12.
Of course, students can simply write out the multiples for 3 and 4. Most math textbooks even suggest doing so. But not all students are capable of doing so or have time. I’ve had many students with special needs in my classroom, and they use the fraction chart to great success. Having another resource to cement these concepts is very helpful to students.
I’ve found that it’s important to think of the chart as a resource and not as a trick. Often, it’s another tool to check their work, and my kids love that because we’re all about proving our work. In my classroom, students still do plenty of model work and estimation, but we’ll also learn how our multiplication chart can verify our fraction work.
Instead of keeping the patterns that exist in the chart from students, why not allow them to use it while they find patterns in fraction equivalency, simplifying and comparing fractions, and adding or subtracting fractions? These calculations are notoriously difficult for kids, but using their fraction chart gives them another way to determine reasonability and predictability of answers.