Representing Student Proficiency and Progress With Visual Rubrics
By creating a visual representation of students’ performance, teachers can help them make sense of their skills and areas for growth.
Your content has been saved!
Go to My Saved Content.
I’ll never forget that day. After glancing at the grade on the last page, a student casually tossed his biology test into the recycling bin as he headed to his next class.
I was shocked. Wasn’t he curious about what he had missed? Did he notice all the comments I had painstakingly written in the margins? The trashing of that test forced me to ask myself: Was it futile for me to encourage deeper learning when the grade was the only goal? This haunting question led me on a journey to find a way to give feedback that students couldn’t ignore. I envisioned a graphlike diagram that painted a clear picture of their understanding—without numbers.
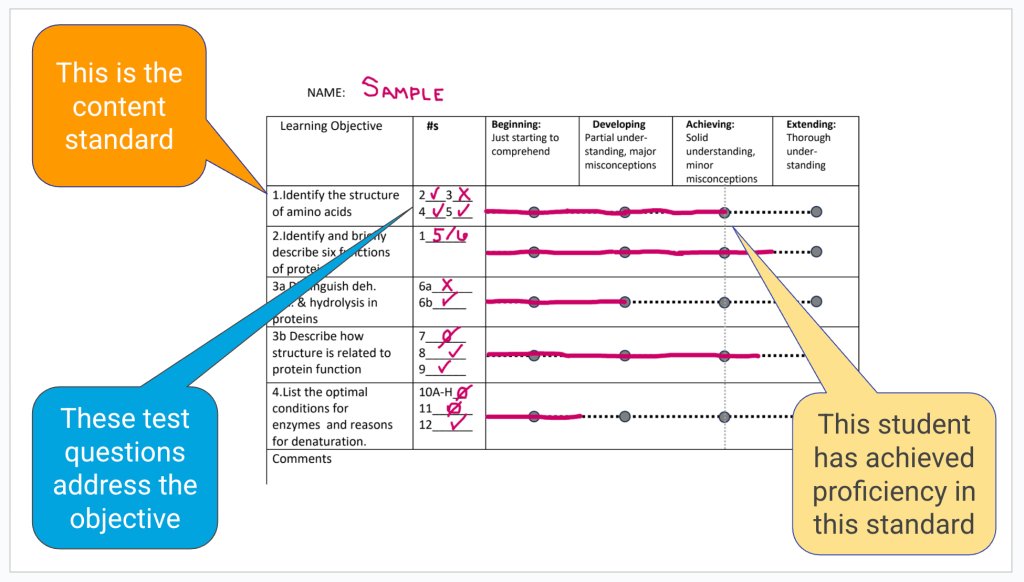
Visual Rubric 1: The Bar Chart
My first step was to revamp the way I graded unit tests. To transform a percentage into an infographic, I implemented a standards-based approach. I stopped using points to calculate a grade, designated and defined four levels of mastery (Beginning, Developing, Achieving, and Extending), and used a holistic approach to evaluate each learning objective. The final product: a reporting tool that uses the framework of a multilevel rubric but resembles a bar chart to help students pinpoint strengths and weaknesses in one glance. Students earn a score out of four for each learning objective and can immediately target standards that fall short of proficiency for revisions and retakes.
Visual Rubric 2: The Spider Web
While I easily adapted this rubric for each subsequent test by inserting new learning objectives, grading lab reports presented a different challenge. It required evaluating the same seven to nine science practices over and over. I needed a rubric that could also show growth over time.
Months later, I found the perfect tool after coming across John Meehan’s brilliant Spider Graph, which was inspired by the multidimensional character sheets central to games like Dungeons and Dragons. I replaced his language arts competencies with the eight main sections of a lab report.
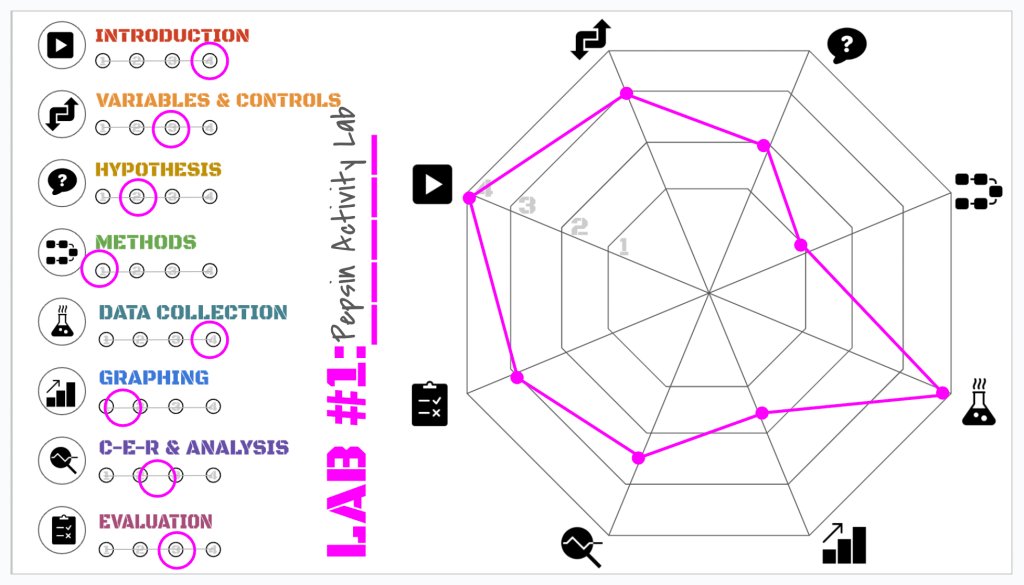
I love the way this rubric highlights the interconnectedness of skills and represents actual geometric areas of growth. It is customizable to any set of skills in any subject and easily distributed digitally or printed on paper. After recording my rating for each section, I give students a few minutes to drag and drop (or color and connect) the eight dots. This simple act of weaving their web invites active participation and self-reflection.
The finished product serves as both a tangible reminder of their current skill levels and a handy baseline for the future. New scores from subsequent lab reports can then be overlaid on the original. The goal is for students to see their level of mastery and the size of their web increase over time.
The Impact
Though it was disheartening and logistically challenging to convert my rubrics back to percentages for our learning management system, I remain committed to this practice because I’ve already seen benefits that far exceeded my original hopes.
In an anonymous poll, my students reported that the visual rubrics helped them do the following:
- Spot areas of confusion more clearly
- Set clearer goals with a smaller range
- Experience less stress
- Feel less discouraged
- Care less about grades
- Focus more on learning
The most remarkable change, however, is the complete transformation of the classroom atmosphere when I hand back tests. I used to brace myself for an explosion of anguished cries, celebratory yells, and nosy comparisons. Now all I hear is a low murmur as students pore over their bar charts and share with classmates which ratings confirmed or contradicted their predictions, often citing specific concepts as evidence. They’re no longer competing; they’re conferring. This is my vision of feedback as it was meant to be—not a final stop, but a conversation starter.
And the best part? I haven’t seen a single test in the trash.