
Student Data: Friend or Foe?
Research is suggesting that gathering student data and building relationships must go hand in hand.
At Bryan Adams High School Leadership Academy in Dallas, four teachers sit in an empty classroom staring at a whiteboard, where a spreadsheet lists 120 students’ names on one axis and their related strengths, concerns, goals, and interventions on the other.
“I’m going to give you some time to look over your kids to see if anything pops out—any behavior changes, for better or worse,” says Caitlin Lyons. “Let’s say three minutes.”
A former chemistry teacher, Lyons now serves as the school’s Building Assets, Reducing Risks (BARR) coordinator. BARR is a program proven to help high schools like Bryan Adams use data to reduce dropouts and increase course passing rates. In this afternoon meeting, teachers chat about who has been coming to class, who has been getting grades up, and who might need a schedule change to avoid unruly friends.
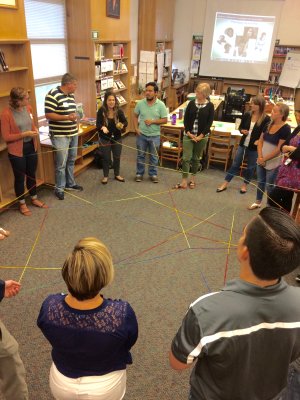
The teachers also identify students who need interventions. Two students, they note, have recently been skipping class and need Saturday school. Another student is moving in the other direction: She’s doing well in sports and barely failing one class. Her teacher speaks up, assuring everyone that the student will continue to bring her grades up over the next few weeks: “She’s a champion,” the teacher affirms.
In American schools, it seems as though nearly everything is counted and tracked. After the passage of the No Child Left Behind Act (NCLB) in 2001, states and districts were required to report on a battery of student outcomes, and faced severe punishments—including school closures—for chronic poor performance. The watershed law, coupled with increasing technological capabilities, has pushed school systems to start monitoring an overwhelming array of metrics, from class participation to attendance and suspensions.
When used adeptly, this data can help teachers target interventions for students who struggle or help school systems unearth hard-to-spot disparities in discipline practices or graduation rates.
But used poorly, data can feel like an instrument of punishment rather than promise. For teachers, especially, the resulting emphasis on assessment and metrics can feel like a betrayal of the craft. Constant testing distracts from valuable instruction time and relationship building, they argue, and reduces students to numbers on a spreadsheet—while forcing cutbacks to crucial enrichment and elective classes, and even recess.
“Standardized testing and mandates for ‘data-driven instruction’ have made teachers’ work less rewarding and more stressful, reducing professional autonomy and curtailing opportunities for teachers and students to have meaningful personal interactions with students and colleagues,” writes Lois Weiner, director of the Urban Education and Teacher Unionism Policy Project, in the online journal Jacobin.
Connecting the Dots: SEL and Data
But not all data use is punitive, and not all programs reduce students to mere numbers.
Twenty years ago, former school guidance counselor and BARR founder Angela Jerabek felt hopeless after watching half of the ninth graders fail a class for five years in a row. Jerabek went to her principal to resign, but he asked her to instead design a program to get the entire staff working together to help students succeed. She never imagined that two decades later, the data-driven program she created for her school in Minnesota would be used in more than 100 schools in 15 states and Washington, DC, after receiving a prestigious Scale-Up grant from the U.S. Department of Education.
“The two pillars [of BARR] are building positive, intentional relationships and gathering data—it works because the inputs are social-emotional, and the outcomes are academic,” says Jerabek of the program, which studies have found dramatically improves student achievement, with an effect particularly strong for disadvantaged students.
Hoping to see similar results, the Dallas district launched the program this past school year at Bryan Adams, where a high percentage of students were classified by the state as at risk for dropping out. At the school, 89 percent of students are economically disadvantaged, more than a third are English language learners, and 82 percent are Latino.
Using a low-tech Google Sheets template provided by BARR, Bryan Adams now tracks and analyzes freshman attendance, course failures, behavior, and strengths, while helping teachers connect the dots in the data with support from BARR-trained site coordinator Lyons and a coach who visits twice a year.
But central to the new approach is helping teachers understand the why behind the numbers. Through weekly classes called iTime, all Bryan Adams freshmen share challenges and participate in team-building exercises with teachers and peers. These interactions humanize the data, helping to foster relationships that shed light on complex social dynamics that add critical context to the assessments. Teachers then brainstorm solutions, like a class switch to get a student away from an ex or adding an extracurricular activity to keep a student from hanging with the wrong crowd.

It’s not a one-way street, either: Teachers also open up to their students. After English teacher Alexa Adams told students about her mother’s experience as an immigrant, one student shared that he had been missing school because his father had been deported. Adams and other teachers then created an intervention plan, and his grades subsequently improved.
“I have to believe that this level of trust and comfort is due to the support he feels from me and the rest of his teachers academically, as well as personally,” Adams said.
In just one year, Bryan Adams has seen an impact: The course failure rate for freshmen at Bryan Adams dropped from 44 percent to 24.8 percent in 2017–18, and the school’s test scores continued upward trends, while out-of-school suspensions decreased overall.
A Data Minefield
Yet many educators feel overwhelmed by the sheer amount of data used in their schools and have found that over-reliance on data can obscure student outcomes.
As a researcher evaluating instruction in New York City, Susan Neuman, professor of childhood and literacy education at New York University reports seeing data walls in elementary schools with rows of student test scores that were often visible to both teachers and students. While data coaches might talk through the test scores with teachers, they often don’t provide clear advice on how to improve the numbers, placing a near-impossible responsibility on teachers to respond in real time in a busy classroom, Neuman says.
“The theory of data-driven instruction is that you use data and analyze it to plan for instruction and enact instruction that’s differentiated for students, but it’s a failed theory of action,” said Neuman. “Administrators end up calling for more data rather than more instruction.”
According to the Data Quality Campaign’s 2016 Time to Act report, the sheer abundance of data can be a minefield that’s hard for educators to use effectively, given resource and time constraints. A multiyear study of 250 teachers reported that while teachers have access to data and tend to use it in some ways, access and use on their own did not lead to student improvement.
And similarly, data use by teachers with students was problematic: The University of Southern California has found that teachers’ public display of data and student-to-student comparisons often leave students feeling frustrated and apathetic rather than motivated—the opposite of the intended effect.
Going Beyond Test Scores
Poor uses of data do not mean schools should steer clear, though, according to Alex Bowers, associate professor at Teacher’s College at Columbia University. A judicious, targeted use of data by educators coupled with careful coaching for them and qualitative assessments of students can yield significant improvements, especially when the definition of data expands beyond testing.
There are signs indicating this approach may be gaining traction nationally.
The 2016 passage of the Every Student Succeeds Act, which replaced NCLB, rescinded the requirement that educators be rated based on annual student test scores, allowed states to use graduation rates and competency-based assessments to show student learning, and made school climate metrics such as surveys that measure student well-being compulsory.
Districts, too, have abandoned performance pay models and are increasingly looking for ways to think about and use data differently. The Strategic Data Project at Harvard University, for example, has trained more than 250 data strategists to work in districts and has partnerships with 15 states, while the Atlanta Public Schools Data and Information Group consolidates the Atlanta Public Schools data on easy-to-read data dashboards for teachers.
At the same time, organizations such as BARR, New York’s Performance Standards Consortium, and the nonprofit Brick are coaching teachers and administrators to use data more effectively. At Achieve Community Charter School—a high-poverty school in New Jersey that is part of the Brick network—teachers generate and assess the data themselves through regular observation of students in a variety of small group settings.
Kindergarteners at Achieve who started the year behind in literacy goals are now on track to exceed the national average.
“Data use and evidence use in schools is all about building relationships,” said Bowers. “The school leader shouldn’t be telling teachers which data are important and what to do next—they should facilitate these kinds of conversations. Teachers [should have] multiple, sustained opportunities to sit with data they feel is most important.”