
Taking a Deeper Look at Student Data
Acting as data detectives, school leaders and teachers can work together to better understand student needs.
Your content has been saved!
Go to My Saved Content.
To all his teachers, Jacob* seemed to be doing OK in school. He showed up to class, did what was expected, and never drew attention to himself in a way that prompted concern. He wasn’t on anyone’s radar. That changed when we took a deeper look, pulling together all of his data to reveal an unseen issue.
Jacob’s cognitive abilities were meeting expectations, but his data showed a language gap. His grades were generally on track, but lower in language-rich subjects. And although he seemed outwardly content, a school and self-perception survey showed low confidence in learning and an attitude toward school that worried his teacher.
"I had no idea this was going on,” his teacher told me, as the picture became clear. And that was when I really felt the power of what we were doing. Because although we’d collected data for years, I’d never sat one on one with a colleague, interrogating numbers, spotting patterns, drawing out observations, and making the process human.
The Problem: Numbers with no narrative
Many schools these days invest in data collection, which, when used well, can improve both student outcomes and student well-being.
But often, the data remains unused or is used in isolation. The math department may only look at the math grades, while other school staff are only looking at student well-being. At best, this creates an uneven student profile that doesn’t help teachers know how to truly reach their students.
When students’ needs sit across multiple data points, they can become invisible. And that’s when we lose the opportunity to truly get to the source of whatever may be holding the student back, and to create the conditions to help them flourish.
To address this issue, I decided to work one on one with my teachers and look at all the data together to create a holistic picture. With 400 students and 20 teachers, this was a significant time commitment. However, the one hour I spent with each teacher led to a class profile full of valuable insights and a replicable process that the teacher could continue to perform alone in the future.
A FRAMEWORK FOR Working as DATA DETECTIVES
I like to frame this entire process as detective work: My teachers and I worked together to be data detectives, treating each student like a case we were tasked with solving.
Interview the witness. When solving a case, a witness statement can be a crucial piece of evidence. Our witness—the teacher—can offer personal knowledge through their observations and daily interactions with their students.
In each one-on-one session, I asked the teacher questions such as these: What are you seeing in your classroom? Who are you worried about? Whose behavior puzzles you? Who do you think is ready for a challenge? The teacher’s professional judgment gives a holistic picture and validates their expertise. Their account is something no test, or survey, can replace. It’s what adds the human element to the data scrutiny that comes next.
Lay out the evidence. As with any case, the more sound evidence there is, the more confidently the detective can draw conclusions. So, the next stage is to lay out all the relevant data you have for each student and look at the picture it creates.
Knowing that tracking multiple data points on a screen can be overwhelming, I printed out one huge spreadsheet per grade and taped it together. This meant that we could physically move through the data (aided by two large rulers borrowed from the math department).
In my school’s case, we used data from reading tests, cognitive abilities, the most recent report grades, and attitudes to self and school surveys. But it doesn’t matter what data you have; the process is the same. Go student by student, not data source by data source, layering each source on top of the last and looking for patterns, contradictions, and surprises.
Build the case file. The case file—a collection of evidence used to aid decision-making—is where the data comes to life, with real implications for the classroom.
We created a document for each class, with one row per student and columns to note findings per data source. This is where the process turns from reporting to understanding. What gets put into this document is not just what the data says, but what it means.
For example, the student registers as highly able and talented? Write, “Challenge in all subjects.” A student scores low in feelings toward school and teachers? Write, “Find moments in class to check in, support, and build a connection.” This was the point where I noticed the teachers’ enthusiasm and excitement pick up: They were understanding how to make meaning from the data and beginning to crack the case.
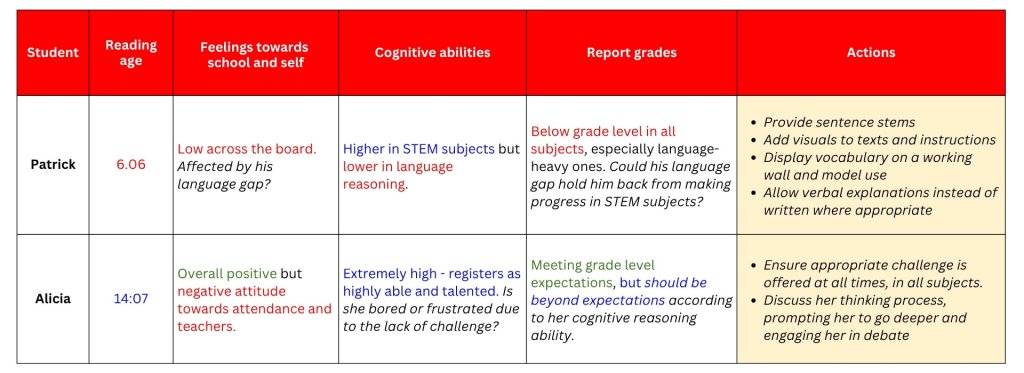
Here’s an example grade five class profile:
Know when to call in forensics. In most cases, the data combined with the teacher observations paint a clear enough picture of what each student needs. But sometimes, there’s a student for whom the evidence isn’t enough on its own. That’s when it’s time to call in forensics.
In one teacher’s case, that student was Caleb. Caleb’s results were fine across the board, but his teachers had witnessed a change in the past month. Caleb had gone from being an open, outgoing student to one who was withdrawn and wouldn’t engage with learning.
We met with the school psychologist, who confirmed that Caleb’s parents were in the early stages of separating. What Caleb needed wasn’t more graphic organizers or to be praised for his effort. He needed to know that school was a safe place and there were adults he could talk to.
It’s cases like Caleb’s that can be the hardest to crack, as there are no obvious data signals. In these instances, the experts can offer that missing evidence piece that pulls the whole picture together.
Closing the case. After our session, Jacob’s teacher left with two clear action points. The first was academic: provide sentence stems, display vocabulary on a working wall, and offer visual supports to close the language gap—strategies that would benefit other students too. The second was pastoral: find moments to praise effort, reflect on progress, and help Jacob see himself as a capable learner.
That’s what data can do when someone takes the time to make it human. It’s not about more spreadsheets, or another dashboard, but a conversation, a process, and one document that means no student is ever invisible again.
*All student names have been changed to protect their privacy.