Lesson 7: How to Collect and Evaluate Observations in the Field
Wrap up the curriculum with a primer on field analysis.
NatureMapping (NM) uses student data to help create a national biodiversity database, which offers scientists a great tool to learn about animal movement, behavior, and population changes. However, schools and scientists-in-the-making can also use the database. This final lesson teaches students how to use the database and similar technologies for data collection and analysis, shining a light on important math and analytical skills.
Although this lesson wraps up the curriculum, you can carry on with the project. Take students on regular field trips and explorations in which they can continue to identify, record, and analyze field data. Or ask local farmers or horticulturalists to lead a hike. For future lesson plans or ideas for more student involvement in nature, visit the NatureMapping Web site.
Lesson Objectives and Materials
Objectives
Students will
- Understand how people use data to answer questions
- Learn how to complete and submit the NM data-collection form
- Use cognitive-thinking skills
Materials
- NM data-collection form
- Field guides or animal fact sheets
- Field journals (bound scientific notebooks)
- Graph paper
- 10- by 20-inch paper
- Adhesive dots or stickers
- Microsoft Excel
Recording Data Accurately
Teach students the importance of recording data properly. Use the NM data-collection form as an example throughout this exercise. Follow these steps:
1. Engage students in the activity by asking
- Would we see different animals if we collected data at different times of the day?
- Why is data important to researchers and scientists?
- Why is it important to collect data correctly?
2. Give an example of data collection that includes inconsistencies, such as the chart below, which shows different sections of the NM data-collection form. This chart highlights how one can record data in an inconsistent way.
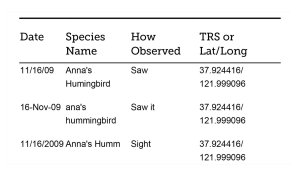
3. Ask students to explain what they see, emphasizing the pros and cons. Then highlight the inconsistencies.
- The student wrote the date in three different formats. The NM format is MM/DD/YYYY.
- The student listed "Anna's hummingbird" as the species name in three different ways.
- In the "How Observed" column, the students has written that she observed the animal through sight in three different ways.
4. Remind students about why and how NM uses student data to study animal movement, behavior, and preservation.
5. Visit NM's Wildlife Distribution Maps page to see what species live in your school's location. Show students the number and types of animals that live in the area.
6. Explain the proper way to prepare and submit data to NM, emphasizing the need for consistency throughout. For example, NM asks students to enter the common name and the scientific name of each species observed and to enter the specific ways in which the students observed them (for example, Saw, Trapped, or Heard). Make note of the capitalization and spelling standards.
For more information, visit How to Participate in the NatureMapping Program.
Practice Analyzing Data
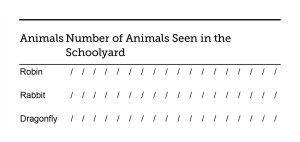
Pre-Lesson Preparation: Prepare a large graph on 10- by 20-inch paper with several blank rows and columns. (See the chart below.) You will use this graph to list animal species and their numbers. Hang the blank paper horizontally on a flat surface.
Before this lesson, ask students to create a data-collection form that includes all the animals they've observed during their sit-spots or that they've seen from home, marking the number of times each animal was seen. Then collect the data in class to practice data analysis.
Follow these steps:
1. Ask students to name the animals they've reported on their data-collection forms. Record each animal just once in the left-hand column of the graph.
2. Ask students to record multiple sightings by sticking dots or other stickers beside the animal's name on the list. If the student saw the animal more than once, the student should write the number on the sticker.
3. Complete the graph by asking students to label the x axis and y axis and to give the graph a title. Here's an example of a simple graph:
4. Add more information to this graph for complexity, or create new graphs with additional information. Other graphs might include
- Sight time
- Sight date and season
- Animal location
- Animal habitat
- Animal activity
5. Review the graphs as a class for accuracy. Ask
- Do the graphs make sense?
- What do they tell us?
- Does everything add up correctly?
6. Brainstorm analytical questions from the data. For example
- How many more robins than rabbits did we see in the schoolyard?
- Why were more squirrels around at lunchtime than after school?
- What activities were certain animals involved in at different times during the day?
7. Copy the data into a computer spreadsheet, such as Excel, so you can analyze it using the questions above as prompts. Or use the following ideas to analyze the data:
- Graph (in a pie chart) the number of species seen according to month, time of day, or location.
- Plot data points on a map of the area, and see what you can learn from the map.
- Older students can collect data using NM's NatureTracker software on a handheld device or GPS unit, hot-sync the data onto a computer, and review the points on a map. Look over the points to determine if students made any mistakes or to interpret the data.
8. Review the results and form conclusions. Encourage students to ask questions that can be answered with the data. Work together to come up with some anchor questions that everyone can use, then encourage a lot of additional questions. Here are some examples:
- Locate places that we missed in the sampling. Do these areas lack critters, or did we forget to look in those locations?
- How much biodiversity exists in the areas plotted?
- What kinds of animals did we see most often? Hear most often? Recognize by clues most often?
- Have multiple students reported the same data?
- How do the results reflect on where humans live? For example, would people want to live in an area with a large animal population? How do human populations influence wildlife behavior?
Practical and Assessment
Practical
Test your students' ability to think analytically. Ask them to create a data-collection form from their field journals and to come up with at least three questions they want to answer. Then they will sort and analyze the data to answer the questions. Be sure to clearly discuss the criteria for assessment.
Assessment
How'd your students do? Here are some ways to assess your students' ability to analyze data, reflective of grade level.
Exceeds standard:
- Student has accurately completed the data sheet so he or she can easily transfer data to charts or graphs.
- Student was able to sort data into different categories.
- Student was able to count and data in different categories either by hand or using a spreadsheet.
- Student has asked and answered three questions about the data.
Meets standard:
- Student has made occasional mistakes on the data sheet.
- Student was able to sort data into categories.
- Student was able to count data points in one category.
- Student was able to answer just two of the three questions about the data.
Below standard:
- Student had irregularities and made mistakes in the data sheets.
- Student had difficulty sorting and counting data points.
- Student had difficulty writing questions that he or she could answer with the data.
Teacher Tips
Bring an English-learning component to the lesson by emphasizing how spelling, capitalization, and exact wording lead to better data analysis.
Related NatureMapping Activities
If you enjoyed this lesson, check out these links to additional NatureMapping materials.
- Data Collection Protocols: This activity teaches students the skills to complete the data-collection form properly for submission to the NatureMapping Program.
- Using Emerging Technologies to Collect and Analyze Data: This activity shows students how to migrate their data from data-collection forms and maps to NatureTracker data collection software and GPS units; teaches the concept of Geographic Information Systems (GIS) through an exercise using Powerpoint and Excel; and helps students understand the basics of GIS.