The Power of Visualization in Math
Creating visual representations for math students can open up understanding. We have resources you can use in class tomorrow.

When do you know it’s time to try something different in your math lesson?
For me, I knew the moment I read this word problem to my fifth-grade summer school students: “On average, the sun’s energy density reaching Earth’s upper atmosphere is 1,350 watts per square meter. Assume the incident, monochromatic light has a wavelength of 800 nanometers (each photon has an energy of 2.48 × 10⁻¹⁹ joules at this wavelength). How many photons are incident on the Earth’s upper atmosphere in one second?”
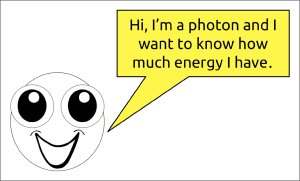
My students couldn’t get past the language, the sizes of the different numbers, or the science concepts addressed in the question. In short, I had effectively shut them down, and I needed a new approach to bring them back to their learning. So I started drawing on the whiteboard and created something with a little whimsy, a cartoon photon asking how much energy a photon has.
Immediately, students started yelling out, “2.48 × 10⁻¹⁹ joules,” and they could even cite the text where they had learned the information. I knew I was on to something, so the next thing I drew was a series of boxes with our friend the photon.
If all of the photons in the image below were to hit in one second, how much energy is represented in the drawing?
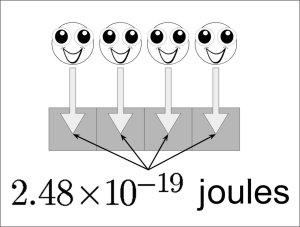
Students realized that we were just adding up all the individual energy from each photon and then quickly realized that this was multiplication. And then they knew that the question we were trying to answer was just figuring out the number of photons, and since we knew the total energy in one second, we could compute the number of photons by division.
The point being, we reached a place where my students were able to process the learning. The power of the visual representation made all the difference for these students, and being able to sequence through the problem using the visual supports completely changed the interactions they were having with the problem.
If you’re like me, you’re thinking, “So the visual representations worked with this problem, but what about other types of problems? Surely there isn’t a visual model for every problem!”
The power of this moment, the change in the learning environment, and the excitement of my fifth graders as they could not only understand but explain to others what the problem was about convinced me it was worth the effort to pursue visualization and try to answer these questions: Is there a process to unlock visualizations in math? And are there resources already available to help make mathematics visual?
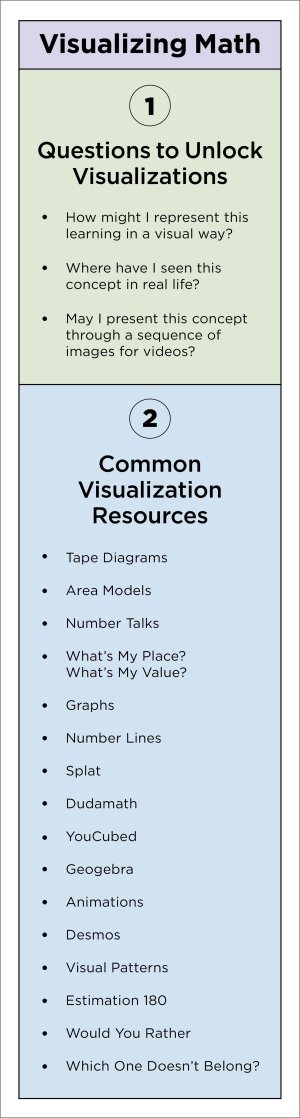
I realized that the first step in unlocking visualization as a scaffold for students was to change the kind of question I was asking myself. A powerful question to start with is: “How might I represent this learning target in a visual way?” This reframing opens a world of possible representations that we might not otherwise have considered. Thinking about many possible visual representations is the first step in creating a good one for students.
The Progressions published in tandem with the Common Core State Standards for mathematics are one resource for finding specific visual models based on grade level and standard. In my fifth-grade example, what I constructed was a sequenced process to develop a tape diagram—a type of visual model that uses rectangles to represent the parts of a ratio. I didn’t realize it, but to unlock my thinking I had to commit to finding a way to represent the problem in a visual way. Asking yourself a very simple series of questions leads you down a variety of learning paths, and primes you for the next step in the sequence—finding the right resources to complete your visualization journey.
Posing the question of visualization readies your brain to identify the right tool for the desired learning target and your students. That is, you’ll more readily know when you’ve identified the right tool for the job for your students. There are many, many resources available to help make this process even easier, and I’ve created a matrix of clickable tools, articles, and resources.
The process to visualize your math instruction is summarized at the top of my Visualizing Math graphic; below that is a mix of visualization strategies and resources you can use tomorrow in your classroom.
Our job as educators is to set a stage that maximizes the amount of learning done by our students, and teaching students mathematics in this visual way provides a powerful pathway for us to do our job well. The process of visualizing mathematics tests your abilities at first, and you’ll find that it makes both you and your students learn.