A Math Framework for Multiple Grade Levels
Using simple images, the Splat! lessons teach a range of math concepts at different levels of difficulty. Download 50 free lessons.

As a K–12 district math coach, I travel to 67 classrooms and participate in math instruction at different grade levels. Traveling outside of my school district, I’ve communicated with many pre-K through university math educators in person, on campuses, at conferences, and through social media.
I’ve encountered rich math experiences at the secondary level, but found that they could not easily be transferred to primary classrooms. Likewise, I’ve experienced some highly effective practices in primary classrooms that would be difficult to implement in secondary settings. And I’ve noticed that elementary teachers generally converse with other elementary teachers and secondary teachers most often converse with one another. So I developed an activity—a series of animated PowerPoint slides called Splat!—that’s designed to be used and discussed across a wide range of grade levels.
The Lessons
There are 50 free, downloadable Splat! lessons. They’re sequenced in 10 levels to offer opportunities to focus on concepts ranging from identifying missing addends to understanding remainders to solving equations involving two or more variables.
The simple premise is that a set of dots is shown on a screen. A “splat” or blob covers some of the dots. The question is: “How many dots have been covered by the splat?” At higher levels, multiple splats appear, and fuel understanding of equations, remainders, variables, and eventually fractions.
Level 1
The first level of Splat! includes four steps within the animation of each slide—see the example just below. Step 1 reveals a set of dots. The teacher asks, “How many dots are on the screen?” After reaching a consensus, the teacher clicks to the next image and reveals the total (step 2). With the next click, step 3, a splat appears on the screen, covering some of the dots.
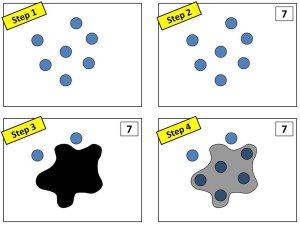
The question now is: “How many dots are beneath the splat?”
Students approach this question in a variety of ways. Some students count up from 2. Often, these students can be seen tracking their numbers using both their voice and their fingers.
Other students notice that two of the seven dots can still be seen and begin contemplating strategies for determining the missing number. Some move toward addition, and try to identify a missing addend. Others think of subtraction and conclude either that 7 minus 2 will yield the answer, or that 7 minus the answer will be equal to 2.
Several strategies have emerged, giving the teacher a range of options for responding.
First, the teacher listens to the students’ strategies. Misconceptions can be caught, which turns out to be highly useful. In most cases, students provide a range of successful strategies and, with the shared visual, are able to communicate their strategies.
Second, the teacher can give students an opportunity to understand one another’s strategies through questioning and reiteration. The valuing of multiple strategies can benefit the classroom culture by communicating that there are multiple ways to think about scenarios and that discussing those ways is beneficial to the learning of others.
Third, teachers can record and compare strategies and then use the students’ ideas to ask further questions. For example, after writing the students’ strategies on the board, a teacher might ask, “I see that one of our strategies shows us that 2 + 5 = 7, while another shows us that 1 + 1 + 5 = 7. What does that help us to understand about the number 2?”
Finally, in step 4, the splat becomes semi-transparent so that the answer is revealed and, more importantly, so that further concepts can be explored. In this example, students can now clearly see that 7 comprises a group of 2 plus a group of 5. Here the teacher has even more opportunities to explore the relationships between these numbers. Some teachers will ask questions such as, “If I moved one of these dots from inside the splat to the outside, what would the picture look like? How is the new picture related to this one?”
Progressive Levels
As the levels progress, further opportunities become accessible. The slide below, from level 3, includes multiple splats and introduces a new rule: “All splats on a slide that are the same color must be covering the same number of dots.”
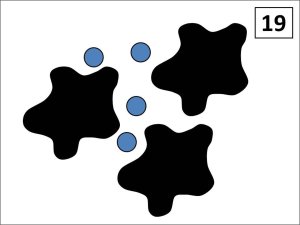
In this case, since all of the splats are black, the rule tells students that the same number of dots are under each splat.
Many students who are accustomed to working with linear equations will quickly see this as 3S + 4 = 19 and go on to evaluate the equation to determine the value of S. However, students in a fourth-grade classroom looking at the same slide often see it in terms of division, with a dividend of 19, a divisor of 3, and a remainder of 4.
I find that connecting the strategies across multiple grade levels is illuminating for students, as well as for me. I ask questions like, “How is 19 ÷ 3 = 5R4 related to 3S + 4 = 19?”
The next image, from Level 4, begins with a different kind of question. The teacher asks, “What could the total be? What is possible and what is not possible?” After collecting a list of possible totals, the teacher can ask, “How are these possibilities related to each other?”
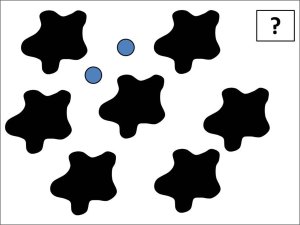
The students realize that among the numbers that are not possible are multiples of 7; the numbers that are possible are 2 greater than multiples of 7. After students explore the possibilities presented by the image, the next click reveals a number in the box, which the students can use to determine how many dots are beneath each splat.
Splat! gives teachers the opportunity to compare strategies and promote mathematical discourse within the classroom. And my hope is that, outside of the classroom, it provides a rich, interesting context for teachers of all levels to share their classroom experiences and love of mathematics with one another.