What Kind of Teacher Do You Want?

The quality and skill of the teacher is one of the most important factors (if not the most important) influencing the success of any learning environment. But you can stand at the front of a classroom and teach until you are blue in the face, and it doesn't guarantee that any learning actually happens. So what separates successful teachers from less successful ones? Anyone will tell you that it's relationships. That's why it is critical to establish and maintain positive relationships with students throughout the school year. It's also not a bad idea to get some learning to happen while you're at it.
One Simple Question
It was from a newsfeed or a tweet that I learned about an activity by Wyoming elementary school teacher, Ms. Freundlich. It was simply called "What kind of teacher do you want?" Every year, Ms. Freundlich asks her first graders this question and puts their answers on a poster that she displays in her room all year long. It was such a great idea that I decided to do something similar in my seventh grade math class at Challenger Middle School in Colorado Springs. Ms. Freundlich's inspiration has led to a mini-project that not only gets the relationship engine firing on all cylinders, but also makes for an authentic mathematical learning experience. Here's how it goes.
It starts with a simple question: what kind of teacher do you want? Students write their responses on a piece of paper. There's no need for complete sentences, just a few thoughts jotted down or a short list will do. After they have written their responses, they get a piece of tape from me (and I make sure at that point to thank them for their effort) and personally post their papers in the room. Last year we used the entire blackboard on one side of the room (Figure 1), but anywhere will work. I made sure every math student on our team of 52 participated. Then I looked at the responses. Quite a few indicated that they want their teacher to be funny, so I seized the opportunity to tell several exceedingly stupid jokes of my own invention. After a brief review, we left it at that -- for the moment.
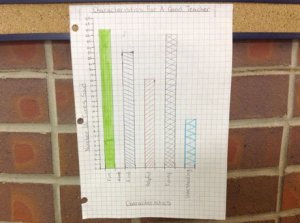
Over the next couple of days, I revisited the papers during class and made a point of giving them consideration. Then it was time to spring the project. The students were asked to work in groups to study the responses, condense them into a manageable number of categories, and produce an easy-to-understand graph about what kind of teacher they wanted. I didn't specify exactly what a manageable number or the "right" kind of graph was -- they had to cooperatively figure that out for themselves (Figure 2). Most decided that bar graphs were best. Each graph went through several iterations, with feedback from me, until they looked good. After making a final graph that filled a sheet of paper, each group went somewhere different around the school to post their work for all to see.

Personal Engagement
Several things came together to make this one of the best collaborative analytical activities I've done.
- The kids were really into it since they were the actual source of data. The data were not numerical but came from their opinions, so there was a strong emotional connection with it. Because of that, there were few qualms about embarking on a critical mathematical thinking journey.
- Since it was announced up front that their graphs would be on display for the whole school to see, it proved to be further incentive to do quality work.
- It was clear to them that I took their responses seriously, and that their input mattered. This made for a large deposit in all of our emotional bank accounts.
Although my view of the project is purely subjective, I think it has been effective at establishing good relationships and a positive learning environment. The kids know that I care about what they want, and I have a better idea of what children hope for in their school experience than I ever had before. And who knows what affect it will have on the whole school population when other students and teachers in the building see those awesome graphs made with pride and hanging in the hallways (Figure 3)? Sometimes all it takes is a simple question.