Beyond the Book: Infographics of Students’ Reading History
I'm an evangelist.
A book evangelist, that is. I hand out books to students and colleagues, booktalking them in class, at lunch, and even in my email signature. I want my students to read widely and read often, to pick up a book instead of browsing Tumblr every time they are bored. But I have no desire to assess my students for each book they read during the year. I'm a voracious reader, but I don't take a quiz after each book I finish. If I did, I don't think I would be a reader for very long! I do want my students to think about some of the books that have affected them and influenced them, though. And I want them to plan ahead and think about the books they want to read in the future. In other words, I want them to be readers.
Recently, I've also been fascinated by the way the human mind interprets visual symbols. From doodling to reading and writing text, the brain is wired with a proclivity for visual sensory ability. In order to help students harness this power, we have been trying our hand at visual notes and sketchnoting in class. Then I decided to try some lessons with infographics. As a class, we analyzed a few popular infographics. But I wasn't happy stopping there. My students were enthusiastic about visual learning, and I wanted to keep going!
When I found this lesson about reading histories, I was inspired. What if I could combine my students' fresh knowledge of visual notetaking and infographics with an analysis of their reading lives? What would they learn about themselves as readers? What would they learn about each other?
Getting Started
I began by having the students brainstorm a list of books they've read. What books do they love? What books bring back awful memories? What books have they shared with others? What books do they love to reread? After sharing some of their lists, I challenged them to continue brainstorming for homework.
The next day, we began to explore some online tools for creating infographics. The tools included:
In pairs, students experimented with the tools by creating sample infographics based on data pulled from an article in that day's newspaper. They made charts, graphs, timelines and flowcharts during that class period. The focus wasn't on accuracy, but rather on experimentation and finding a comfort level with these digital tools.
Reading History Infographic
The next day, we started to work on our own infographics. When I first handed out the assignment, students were confused. They were so used to presenting information about books in written form that they weren't sure where to start with the infographic. "So, you want us to write a book report?" a few asked hesitantly. "No way!" I assured them. That was the last thing I wanted.
But instead of holding their hands as they walked through the project, I encouraged them to explore some mentor texts. They began to talk among themselves, working with the infographic tools and sharing the stories of their reading history. I watched as arguments erupted over whether Harry Potter is the best character of all time, if The Giver is better as a stand-alone novel or part of the companion series. Students recommended books to each other as they reviewed their brainstorming. They were talking about books in an authentic, real way!
We worked on the infographics in class for a few days, the students troubleshooting with one another and sharing book recommendations. More than a handful of students swapped books each day, sharing stories like Ender's Game and Moneyball with each other. "This is the best book! You have to read it!" was a refrain heard over and over again in my room during that week. They also helped each other learn the ins and outs of the new tools available for infographic creation.
The Final Product
I was blown away when the documents started arriving in my inbox. One of my students noted that "by looking into my past readings, I've been able to uncover and reaffirm some patterns in my reading history and rekindle my desire to read more and more." I've never gotten a reflection like that from a book report! Another student shared, "After creating my infographic, it led me to ponder about the next chapter in my reading career." That's what real readers do! My students talked about rereading old favorites and tracking down the next book in a long-forgotten series. They made lists of books they want to read this summer and authors they want to try. In other words, they were acting like readers.
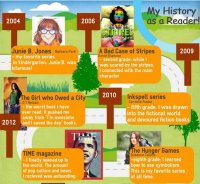
I wasn't sure what to expect when the infographics were first assigned. It was a new assignment, and it was not how my students were used to responding to books. But as you can see from these examples, I was silly to worry.
Creating these infographics was a reflective practice for my students, and it helped them see themselves as readers. For some, this was a revelation. For others, it was a reminder to start making time for reading in their busy lives. Hopefully, this sparked the flame of reading for them. I am seeing more students swap books with each other and talk openly about what they are reading, so I'm thrilled with the result. I love combining digital tools with English class -- it fosters a true culture of literacy, and that's the goal of this book evangelist!